Geopolitical signals, social movements, and narrative shifts tracked through Google Trends, Reddit, and news wire collectors.
Data centers, submarine cables with animated flow particles, internet exchange points, and backbone connections visualized in real time.
Market signals, commodity disruption, and economic indicators aggregated from financial market collectors and scored for novelty.
Telecommunications infrastructure stress, BGP routing events, and network topology changes monitored continuously.
Globe Modes
Four view modes revealing different dimensions of the world's signal landscape.
Realistic mode renders satellite imagery on a full 3D globe with signal markers at real coordinates.
Tactical mode activates grid overlay, radar sweep GLSL shaders, threat radials, and signal correlation lines.
Network mode focuses on infrastructure topology — data centers, submarine cables, and IXP throughput halos.
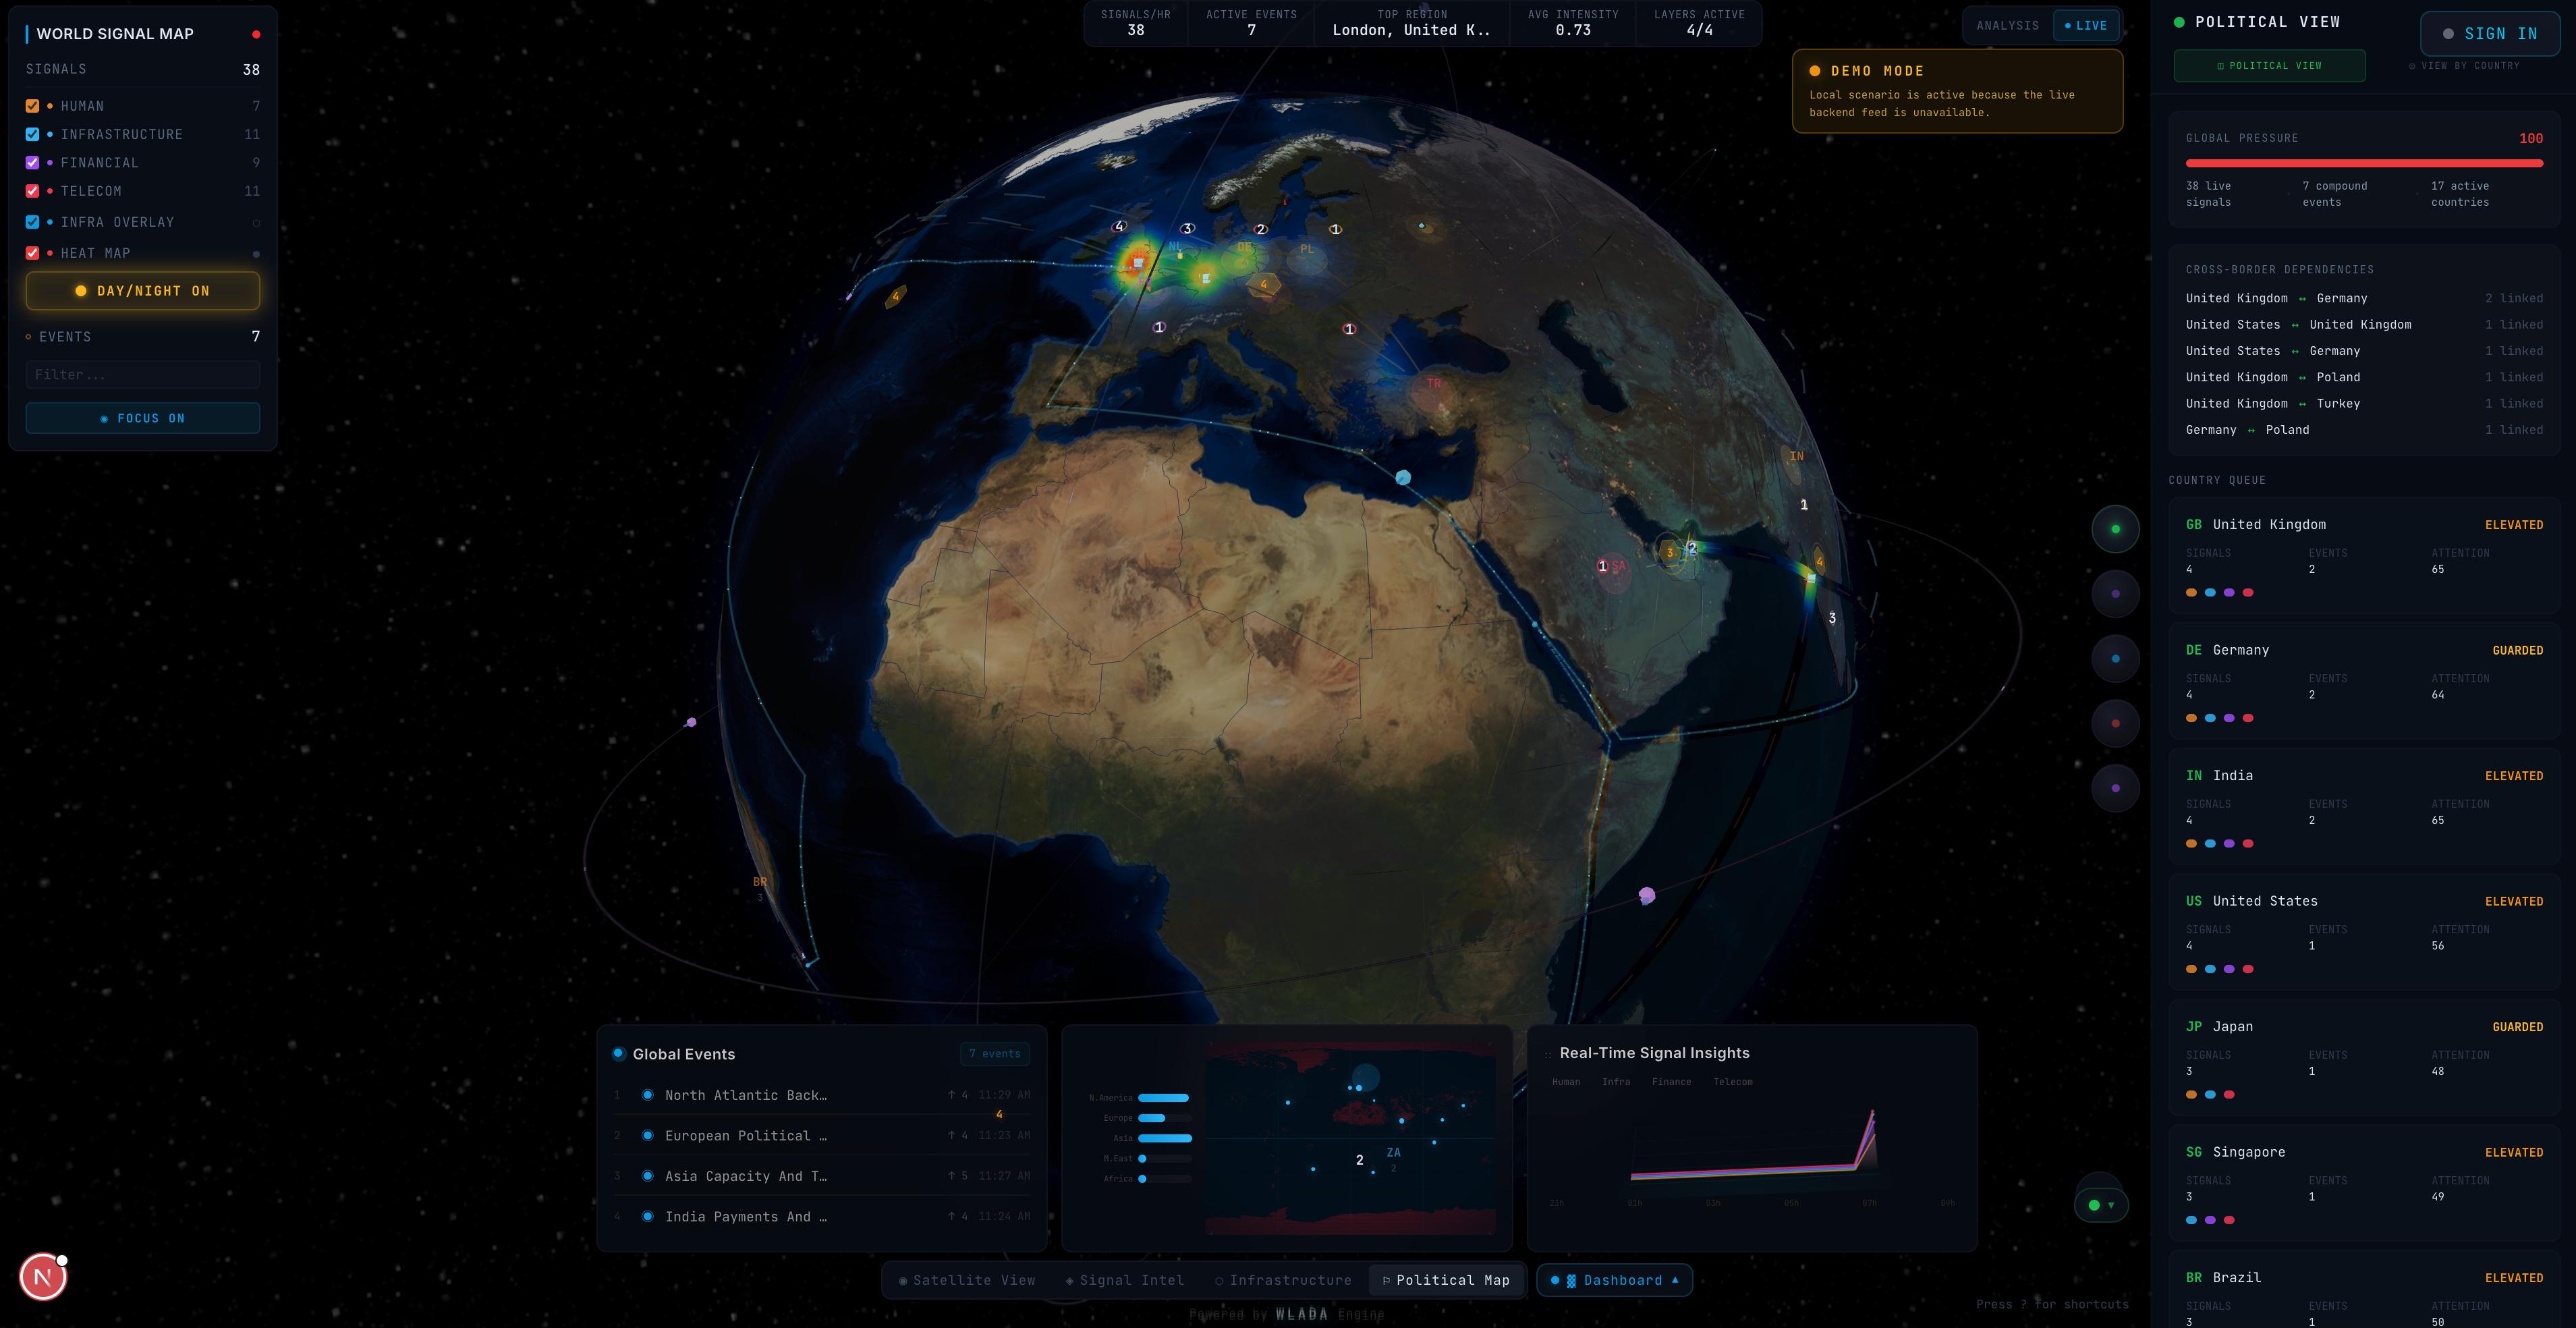
Political mode renders country borders from GeoJSON, political markers, cross-border arcs, and threat heat zones.
Physical geography, location-true coordinates, and persistent event halos pinned to the planet in real time.
Radar-style overlays expose directional pressure, signal convergence, and cross-region escalation paths.
Infrastructure topology becomes legible through throughput lanes, exchange-point halos, and routing stress traces.
Regional heat zones, frontier movement, and politically sensitive corridors appear as a live strategic surface.
Analysis
Timeline replay with scrubber, play/pause, and speed control from 0.25x to 8x.
Replay historical events and investigate how signals propagated across regions. Forensic view reveals dependencies, consequences, and primary sources.
Correlation
Cross-layer correlation traces connections between unrelated signals.
Geographic, temporal, semantic, and entity dimensions connect infrastructure events to financial signals and human movements across the globe.
Technology
Next.js 16, React 19, Three.js, Fastify 5, PostgreSQL, and Redis.
Python signal engine processes collectors for Google Trends, financial markets, infrastructure/BGP, and news wires. WebSocket streaming with 100ms batching.
World Signal Map · WLADA
Every signal scored for novelty and intensity with explainable reasoning.
The WLADA Engine powers World Signal Map's signal detection, lifecycle tracking, and correlation analysis across all four layers.